Cleanest Cities in the United States 2026
Cleanliness Score



- Data include a full range of cities, from cleanest to least clean. Many untested cities, if included, would fall somewhere between the first and last cities on the list.
- All component data were collected between 2019 and 2023.
- Cities were often rated in groups. For example, the Washington cities of Seattle, Tacoma, and Bellevue were rated collectively and share the same scores.
- Constituent scores utilize the following definitions:
- Population Density = The # of people per square mile. To avoid warping comparisons between data points, the original source’s own densities are shown rather than more current densities displayed elsewhere at World Population Review.
- Rodents = The % of housing units with signs of mice, rats, or other rodents inside the home within the past 12 months.
- Cockroaches = The % of housing units with evidence of cockroaches inside the home in the past 12 months.
- Vandalism = The % of homes with NO vandalized or abandoned buildings within a half-block radius.
- Litter - The % of homes with NO litter, trash, or junk on the streets or properties within a half-block radius.
- Air Quality = The # of days in 2024 in which air quality was rated Good for levels of CO, NO2, Ozone, PM10, and PM2.5
- Tap Water Quality = The average # of different contaminants detected in the area’s drinking water in excess of Environmental Working Group (EWG) health guidelines.
Pollution is the introduction of contaminants into the air and environment causing adverse effects. With the already high and ever-rising population in urban areas, many cities are plagued with rising pollution levels.
Environmental and Health Effects
In the environment, pollution comes in the form of fossil fuels, litter, coal, noise, light, and sound. Pollution impacts ecosystems on land and marine life. It can muddy waterways, kill plants and animals, and poison the water and air. According to the Environmental Protection Agency (EPA) 44% of streams, 64% of lakes, and 30% of the bay and estuarine areas are not clean enough for swimming or fishing, in the United States.
Pollution is not only detrimental to the environment but also human health. According to Pure Earth, toxic pollution is among the leading risk factors for non-communicable diseases globally. Non-communicable diseases account for 72% of all deaths, 16% of which toxic pollution is responsible for. Pollution is a cause for cardiovascular disease, lung cancer, stroke, and chronic obstructive pulmonary disease.
Regulatory Efforts and Current Trends
In past decades, the United States Congress passed several Clean Air Acts in an attempt to enforce stricter pollution regulation. As a result, carbon dioxide emissions declined from 197 million tons to 89 million tons; particulate emissions fell by 80%; and lead emissions fell more than 98%, among other emissions.
Despite the effectiveness of the Clean Air Acts air pollution has increased by 5.5% since 2016. Air pollution is measured by air-quality monitoring devices that track levels of dangerous particulates. The most harmful of these is called PM2.5, which are tiny enough to enter the bloodstream through the lungs and can cause death. Only 10 micrograms of PM2.5 per cubic meter is deemed safe by the World Health Organization (WHO).
America’s Cleanest Cities
The ten cleanest cities in the United States are:
- Honolulu, HI
- Dallas-Fort Worth, TX
- Denver, CO
- Orlando, FL
- Burlington, VT
- Wilmington, NC
- Syracuse, NY
- Tampa-St. Petersburg, FL
- Lincoln, NE
- Bellingham, WA
Leading Green Initiatives
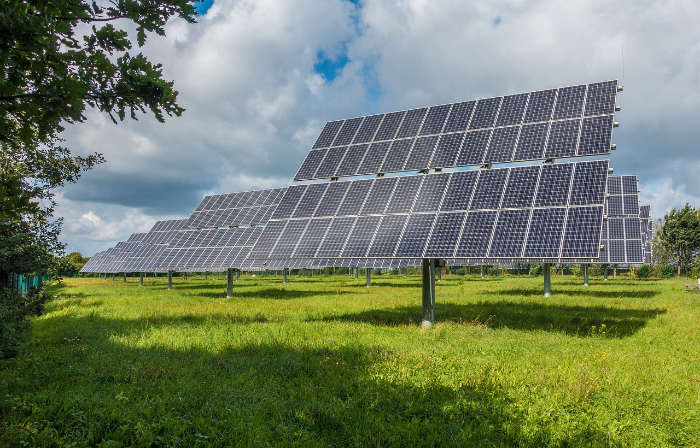
Honolulu, Hawaii ranks first as the cleanest city in the U.S. Despite being the most fossil fuel-dependent state in the U.S., due to its reliance on tourism and the military, Hawaii is currently working to achieve 100% clean energy by 2045. Honolulu is currently working hard to implement its green initiatives, such as using local, renewable energy sources, planting one million trees, and more.
Other cities with green programs are Dallas-Fort Worth, Denver, and Orlando. Dallas’s Clean Slate program pays the homeless to help clean up the streets. Denver’s Clean Cities Coalition funds and implements fuel efficiency, hybrid and electric technology, and community engagement. Orlando has its own Downtown Clean Team, a group of volunteers that does daily trash and litter clean-ups, remove graffiti and overall maintain the city.